(Charlie Riedel /Associated Press)
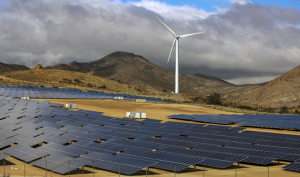
LA Dept. Water and Power Pine Tree Wind and Solar Farm Tehachapi Mt. Calif. (Irfan Khan / LA Times)
Electricity costs for solar and wind have dropped by 80 and 49% respectively, since 2009.
Earth Day 2021 call: California, fight climate change faster – Los Angeles Times (latimes.com)
Greener Energy Means a Different America
The facts and consequences of global climate crises are awesome, depressing, and frightening in human and planetary terms. Climate Corner reviews timely climate science and news reports and selects a few that elicit a resounding “wow” response, positive or negative. Climate Corner shares a few wow words and images”, with links, to motivate you to read more.
At a Glance
- At a White House virtual climate summit attended by 40 world leaders on April 22, it was announced that the US will cut greenhouse gas emissions by 50% below 2005 levels by 2030.
- A plan to achieve this ambitious proposal is condensed into eight points by the Center for Global Sustainability (CGS) at the University of Maryland
- Climate Corner embraces this goal, the US return to the Paris Agreement, and a vibrant America’s “better future” dealing with the climate crisis.
- Expanding on the CGS number one point, namely renewable electricity, the world’s 5th largest economy had 94.5 % renewable electricity on April 24, 2021 and deployed the world’s largest battery energy storage system in December 2020.
- Behind large renewable electrical energy successes are the capacity and reliability of complex, interconnected power grids.
- A clear analogy to avoid the annoying confusion between the terms electrical power and energy is presented in the Appendix.
- Meeting US climate goals relies on government, university, and industry partnerships especially for new, early-stage innovations and technologies. Such collaborations at two national laboratories, Lawrence-Berkeley and Los Alamos are featured in “One Last Thing”.
University of Maryland’s Center for Global Sustainability (CGS) says the US 2030 emissions proposal specifically means:
>50% of electricity from renewable energy
CO2 released from new natural gas plants to be captured and buried
2/3 of new cars and SUVs sold to be battery-powered
All new buildings heated by electricity instead of natural gas
Cement, steel, and chemical industries adopting strict new energy-efficiency targets
Oil and gas producers slashing methane emissions by 60%
Expanding regenerative forestry and agricultural practices to pull 20% more CO2 from the air than today
Original icons from “Planet: The Biden administration…” in
https://futurecrunch.com/goodnews-30-april-2021/
World’s 5th Largest Economy, California, had 94.5% Renewable Power 0n April 24, 2021
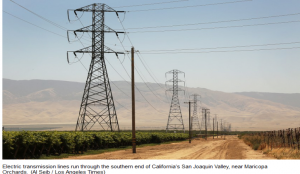
80% of California’s Electrical Power is Transmitted by the Grid System of the California Independent System Operator (CAISO).
The CAISO reported a 94.5% renewable power record on April 24, 2021. The LA Times plot below from this date traces the renewables solar, wind, geothermal, biomass, and hydropower (the green curve). The record power occurred at about 2:30 PM PDT.
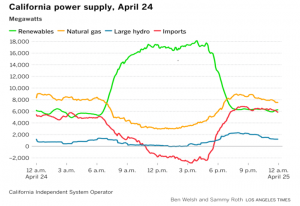
CAISO April 24, 2021 renewables power contrasts with natural gas, large hydro, and imports.
Note that there was considerable natural gas and out-of-state imports that were part of the power mix on April 24, but, at about 2:30 PM the CAISO was able to transfer over -2000 megawattts (MW) of import power that nearly canceled the approximately +2000 natural gas MW for the renewable calculation. This allowed the renewable record calculation.
Climate Corner did not anticipate the record on April 24. However, by chance it recorded the CAISO data (below) on Earth Day, April 22, 2021 for future discussions. This plot was recorded on the CAISO website at 21:45 (9:45 PM PDT). Such plots are updated every 5 minutes, daily and are publically available on the CAISO website, California ISO – Supply (caiso.com).
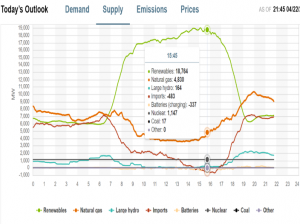
CAISO April 22, 2021 renewables and with other power sources. Actual, annotated MW values at 15:45 (3:45 PM PDT) time are selected.
The April 22 plot is very similar to the record April 24 plot, with additional curves for batteries (charging), nuclear, coal, and other. The CAISO site includes a cursor that allows retrieving the actual MW values for all plotted data. For example, Climate Corner was interested in the values at the approximate peak power in the renewables plot at around 15:45 (3:45 PM PDT) when they were 18,764 MW and natural gas at 4,830 MW, etc .
Many other plots are available on the CAISO website such as the individual renewable sources that comprise the renewable category as plotted below.
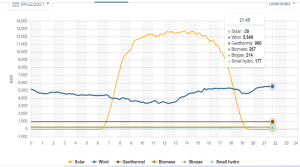
CAISO April 22, 2021 renewables solar, wind, geothermal, biomass, biogas, and small hrdro. Actual, annotated MW values at 21:45 (9:45 PM PDT) time are selected.
Notice (above) that geothermal and small hydro have constant values. Such constant power versus time (24 hours/7 days a week) are referred to as ”base load” or having a capacity factor of 100%. For renewable sources in the US during 2020, geothermal had the highest capacity factor at 74%; wind and solar were 35% and 20 -25%, respectively.
Stastica.com Energy capacity factors in the U. S. by source 2020 – Bing
Note: For Climate Corner readers who would like to understand the difference between electrical power and energy please read the Appendix below.
The Complexity of Electricity Transmission: The CAISO Grid as an Example
The CAISO shares electricity in real-time with the Western Energy Imbalance Market (EIM) that they launched 7 years ago. As the map below shows, there are currently 14 electric grid operators that allow sharing of extra electricity on the CAISO. For example, if California has extra solar power, they can sell it to Arizona who then can reduce their coal-fired power by substituting cheaper, cleaner solar energy.
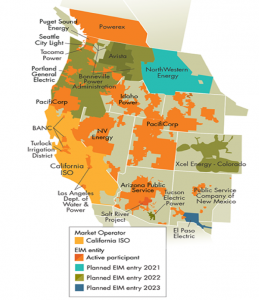
There are currently 14 active participants in the EIM in 9 Western States and British Columbia, Canada
The obvious benefits of western multi-state EIM cooperation have been reported in the LA Times to have been collectively saving $1.2 billion. California alone has benefited by about $300 million. However, there have been some politics that have hampered the full implication of the EIM. For example, in the summer of 2020 California had rolling blackouts on two consecutive nights leaving a half-million homes and businesses out of power for upwards of 2 ½ hours.
Given that more should be done to reduce electricity costs, fossil fuel usages, and power outages, the CAISO Board of Governors on April 21, 2021 signed a set of 2021 summer “readiness initiatives” that prioritize exports, imports, and transfers during electricity shortages that might affect Califronia and the West during the 2021 summer.
World’s Largest Battery Energy Storage System (BESS) Began Operating on December 11, 2020
Notwithstanding the California 95 % renewable electricity success story, EPIC (Energy Policy Institute at the University of Chicago) reported that less than 38% of overall US electricity in 2019 came from carbon-free sources. Most came from nuclear power (20%), with solar and wind accounted for only 7 and 2%, respectively (see EPIC 2021 below, p. 89-90, Fig. 2).
Thus, the announcement of the world’s largest battery storage system connected to the grid, in California, was greeted with expectations for viable future electrical power storage. Phase 1 of the Moss Landing Energy Storage Facility (MLESF) began operation on December 11, 2020. It is currently rated at 300MW/1250MWh and Phase 2 will add another 100MW/400MWhr in August 2021. An energy to power ratio of 4 hours, E/P = 4, is used for all battery technologies. It’s sometimes called the battery system discharge time since it measures the duration that a battery storage system can deliver it’s rated power. Energy to Power Ratio | energymag
The MLESF will use surplus energy from the grid during the day to charge batteries during daylight hours and return power back to the grid when solar and/or wind production decreases. Thereby, helping to facilitate stable, ample, and reliable electricity. There will soon be an additional Tesla, Inc. 183 MW, E/P = 4 Lithium-ion batteries system at Moss Landing site. The current battery system is from the Texas-based Vistra Corporation. Pacific Gas and Electric, the owner of the storage facility, is a participant in the CAISO.
The current worldwide demand for lithium-ion batteries for electric vehicles and utiliy-scale electrical energy storage was called “staggering” in February 2021 by the Statista Research Department. The cost is now $101/kWh, down more than tenfold in just 10 years.
New Energy Outlook 2020 | BloombergNEF – Bing.
Some say the costs are still several times too high for large-scale electric grid integration (see EPIC, 2021 below, p. 91). Microsoft cofounder and philanthropist Bill Gates is one of them. In his 2021 book, “How to Avoid a Climate Disaster”, he explains how extra nighttime battery storage of electricity could cost more than daytime generation alone. This would more than double the energy (e. g., kilowatt-hour) cost. However, Gates says he knows “brilliant engineers” who are working on new bigger, better batteries that could make large-scale storage economical. Obviously, there are investors who agree (see One Last Thing below).
https://epic.uchicago.edu/wp-content/uploads/2021/02/EPIC-Energy-and-Climate-Roadmap.pdf
One Last Thing
Climate Corner recognizes America’s National Laboratories who in collaboration with academics, entrepreneurs, corporations, and others nationally and internationally are joining to mitigate global warming.
Since Climate Corner is familiar with Los Alamos National Laboratory (LANL) and Lawrence Berkeley National Laboratory (LBNL), they are selected for illustration purposes below. Countless cooperative examples deserve to be emphasized but only a couple of “wow” activities will be highlighted for each lab.

LANL FIDO team members deploy a mobile laboratory on the frozen sea ice of the Arctic Ocean in 2020. The German ice breaker Polarstern is in the distance.
https://www.lanl.gov/discover/publications/1663/2020-august/ends-earth.shtml
LANL began in 1943 in Los Alamos, New Mexico where scientists designed and built the first atomic bombs during the Manhattan Project. Since then LANL has engaged in many non-weapon acivities, even though it’s core mission is still “national security”. Non-weapon projects, such as the power source for the Mars Perseverance rover, are about 30% of the lab’s funding. LANL scientists were participants in the year-long MOSAiC program that was discussed in Winter Climate Corner’s focus on the Arctic. Two mobile laboratories with about 50 instruments each were moved, setup, and maintained in the Arctic by Los Alamos Field Instrument Deployments and Operations (FIDO) teams. FIDO teams rotated in two-month intervals from October 2019 on. But, this meant four-months total including to and from the German research ice breaker Polarstern while it was locked in the sea ice. LANL instruments were the largest in number, the most sophistication, and collected the most data compared to the other 60 MOSAiC institutions.

One of 11 geothermal power plants in the Salton Sea area of Califronia.
https://eesa.lbl.gov/geothermal-brines-could-propel-californias-green-economy/
The race is on to strike lithium at California’s Salton Sea – Los Angeles Times (latimes.com)
This year the Berkeley Lab (as LBNL it’s often called) is celebrating it’s 90th year. In 1931 it t was designated by Ernest Lawrence as the Civil Engineering Testing Laboratory. It was eventually named the Lawrence Berkeley Laboratory (LBL) in 1958 shortly after Lawrence died. In 1973 LBL dropped all weapons funding and began exclusive focus on energy and environmental research. The culture of the Berkeley Lab today is built on the legacy of 9 Nobel prizes awarded to Lab scientists. Lab scientists just received over $7 million to work with two private companies to evaluate and analyze the extraction of battery-grade lithium dissolved in the geothermal brines in the Salton Sea area of southern California.They also received $1.7 million to use geophysics to better locate geothermal production wells in the Salton Sea area and at the Geysers in northern California, the #1 geothermal field in the world.
Appendix
Difference Between Electrical Power and Energy Explained
Climate Corner discussions above used the terms power, in megawatts (MW) and energy, in megawatt-hours (MWh). Climate Corner is aware that many people believe the terms energy and power are equal. They are not – this is a common mistake and should be corrected, especially as we make informed decisions about electrification on global, national, state, local, and residential levels. Climate Corner believes that an analogy between an electric power plant and a pumping water well will help. Pumping water is described by a time-rate of gallons per minute. After a number of minutes, the gallons delivered is calculated by multipling the gallons per minute and the number of minutes. The water bill that you pay is for the gallons of water delivered, not the rate that it was pumped.
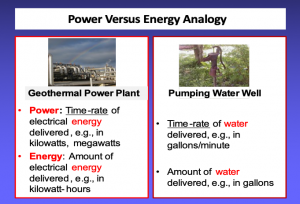
For an electrical power plant, power is the time-rate that electrical energy is delivered. But, the time-rate is not explicitly included in the units of power that are, e.g., watts, kilowatts, or megawatts. To calculate what you pay for electricity, you multiply the time-rate (the power) by the time of use to yield the electrical energy in units of, e.g., watt-seconds, kilowatt-hours or megawatt-hours. This is the amount of electrical energy delivered just as gallons are the amount of water delivered. Most home electric bills charge for the energy used in kilowatt-hours.
The energy calculation is actually the area under the power versus time curves for a chosen time interval, for a chosen power source in the plots above. Clearly, solar power and energy dominate the last plot above.
The energy calculation is very easy for the constant geothermal power of 960 MW above. In one hour, the geothermal energy produced is 960 MWh; for 2 hours it’s 1920 MWh, etc. (Climate Corner readers who remember their calculus class recognize that electrical energy is the time-integral of the electrical power.)
Just as one rates a non-pumping water well by what it’s capable of (it’s capacity in gallons per minute), an electrical power plant is rated by it’s capacity (power), usually in megawatts or gigawatts.
Climate Corner thanks Carl Gable of Los Alamos National Lab and David Alumbaugh of Lawrence Berkeley National Lab for sharing press releases of their laboratories’ recent research activities.
Lead author of Climate Corner is George Jiracek, Navy veteran and Professor Emeritus at San Diego State University (Geophysics). To comment and/or to suggest contributions to SDVFP Climate Corner please contact treasurer@sdvfp.org. Edited by Gary Butterfield.


