Fire, Ice, and Rain
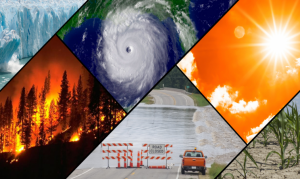
A collage of typical climate and weather-related events: floods, heatwaves, drought, hurricanes, wildfires, and loss of glacial ice. (NOAA).
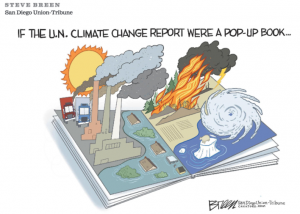
The latest Intergovernmental Panel on Climate Change (IPCC), also called the UN Climate Change Report, was released on August 9, 2021. It’s over 1000 pages long and was prepared by a working group with 234 authors from 66 countries plus 517 contributing authors. It was cleverly summarized above as a pop-up book in the San Diego Union-Tribune. It was also abstracted by Elizabeth Kolbert of the New Yorker using the IPCC’s own words: “many changes in the climate system become larger in direct relation to increasing global warming.” (https://www.newyorker.com/magazine/2021/08/23/the-uns-terrifying-climate-report).
The facts and consequences of global climate crises are awesome, depressing, and frightening in human and planetary terms. Climate Corner reviews timely climate science and news reports and selects a few that elicit a resounding “wow” response, positive or negative. Climate Corner shares a few “wow words and images”, with links, to motivate you to read more.
At a Glance
- It’s official: July 2021 was Earth’s hottest month on record | National Oceanic and Atmospheric Administration (noaa.gov).
- On August 14, 2021, it rained at the highest point on the Greenland Icecap, the latest date ever recorded during any one year.
- The largest wildfire in California history was only 48% contained on August 29, 2021.
- A NASA satellite on August 7 imaged wildfire smoke from Russia at the North Pole, the first time in recorded history.
- Climate Corner challenges readers with U. S. energy costs and DOE’s newly released “Solar Futures Study” aka Biden’s Plan.
- One Last Thing (with a Bonus) exposes a U. S. Army Cold War coverup plan for 100’s of ICBMs hidden in the Greenland icecap; the story has science twists and climate change.
Record Summer 2021 Climate Data
It’s official: July was Earth’s hottest month on record | National Oceanic and Atmospheric (Administration (noaa.gov)
( http://nsidc.org/greenland-today/)
- Around the globe: the combined land and ocean-surface temperature was 1.67 degrees F (0.93 of a degree C) above the 20th-century average of 60.4 degrees F (15.8 degrees C), making it the hottest July since records began 142 years ago,
- Regional records: Asia had its hottest July on record, besting the previous record set in 2010; Europe had its second-hottest July on record—tying with July 2010 and trailing behind July 2018; and North America, South America, Africa and Oceania all had a top-10 warmest July.
- The Northern Hemisphere: the land-surface only temperature was the highest ever recorded for July, at an unprecedented 2.77 degrees F (1.54 degrees C) above average, surpassing the previous record set in 2012.
- Temperatures surpassed the freezing point at Greenland Summit Station on August 14 and rain began then and fell for the next nine hours. This was the third time in less than a decade, and the latest date in the year on record, that the National Science Foundation’s Summit Station had above-freezing temperatures and wet snow. There was no previous report of rainfall at this location (72.58°N 38.46°W), which reaches 3,216 meters (10,551 feet) in elevation.
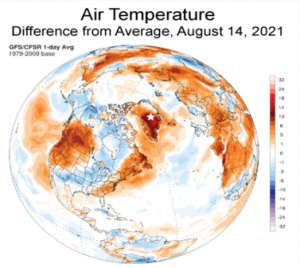
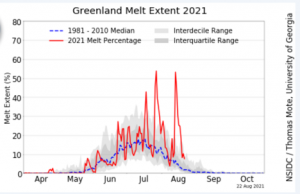
(Left) Air temperatures are significantly elevated in northern hemisphere, especially western and eastern U. S., Greenland, and Siberia on August 14, 2021 compared the average on that date. (Right) Three peaks in satellite measured Greenland surface ice sheet melt extent on July 19, 28, and August 14-15, 2021 exceed considerably the 1981- 2010 mean values. The record melt year was in 2012. Greenland Ice Sheet Today | Surface Melt Data presented by NSIDC
California’s Dixie Fire is the State’s Largest Wildfire Ever
Hotter and drier conditions this summer (and expected this fall) are causing severe wildfires throughout the western U.S. especially in California.
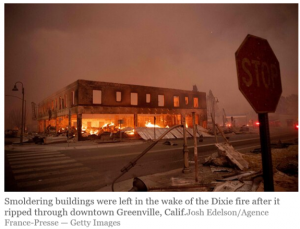
The Dixie fire distroyed the small town of Greenville, CA on August 4
– Getty Images.
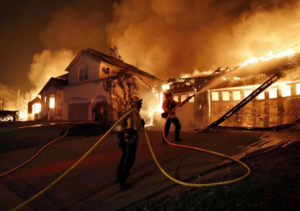
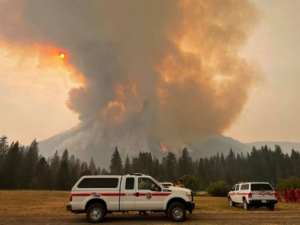
(Left) The Dixie Wildfire has destroyed nearly 500 homes. (Right) It ignited the forests of Lassen Volcanic National Park which normally has about 500,000 people visit the park each year.
The Dixie Fire is one of 17 active wildfires in California as of August 29. It started on July 14, has burned through 776,695 acres and nearly 500 homes have been destroyed. There are 4,500 fire personal fighting the blaze, but still it was only 48 % contained 0n August 29 according to the California Fire Map (https://www.sfchronicle.com/projects/california-fire-map/.)
Siberia Wildfire Smoke Reaches the North Pole
NASA satellite images showed wildfire smoke travelling “more than 3,000 km from Yakutia, Siberia to the North Pole”, becoming “a first in recorded history”. It added that on 6 August most of Russia was covered in smoke.
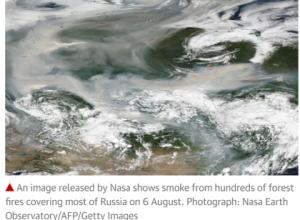
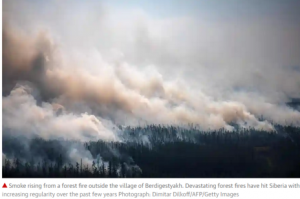
(Left) NASA image shows smoke from 100’s of forest fires over Russian Siberia on August 6. (Right) Forest fire near village of Berdigestyakh, Siberia.
NASA Earth Observatory and Dimitar Dilkoff/AFP/Getty Images (https://www.theguardian.com/world/2021/aug/09/smoke-siberia-wildfires-reaches-north-pole-historic-first)
Environmentalists blame the authorities for letting large areas burn every year under a law that allows them not to intervene if the cost of fighting fires is greater than the damage caused or if they do not affect inhabited areas.
Electricity Costs and the U. S. Solar Futures Study
After the Appendix in the Spring 2021 Climate Corner: “Difference Between Electrical Power and Energy Explained”, there’s been a readers interest in the past and most current costs of electricity from various energy sources. So, since you know what a MWh (megawatt-hour) is, namely the electrical energy from a million watts of power turned on for 1 hour, here we go!
Visual Capitalist’s recent publication (Electricity from Renewable Energy Sources is Now Cheaper than Ever – Visual Capitalist) presents the costs of various energy sources as a graphical 2009 to 2020 comparison and a numerical table. It was published on July 5, 2021; however, the data are average numbers from Lazard’s levelized cost of energy analysis-version 14.0 published on October 19, 2020. See: https://www.lazard.com/perspective/lcoe2020 for more details.
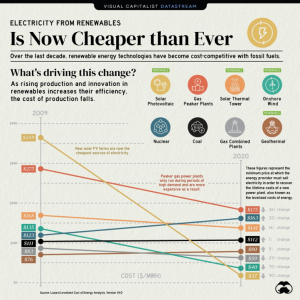
Cost of electricity in $/MWh for major U. S. energy sources from 2009 to 2020.
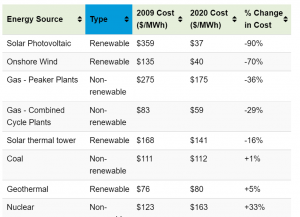
A few comments are:
- Lazard’s average solar photovoltaic $37/MWh energy cost cited above is that for solar PV-crystalline utility scale Lazard’s average solar PV-rooftop residential cost is $188/MWh. Therefore, the levelized cost of residential solar energy is over 4 times that of utility scale solar.
- Utility scale solar photovoltaic electrical energy was the most expensive in 2009 – now it’s the cheapest having decreased by a whopping 90%. A chronicle on how this happened has been published by Gregory Nemet at the University of Wisconsin-Madison: (Nemet, Gregory F. 2019. How Solar Energy Became Cheap. New York, NY: Routledge). A YouTube on this intriguing, international development is presented by Professor Nemet at: https://www.youtube.com/watch?v=MpyqeYDT6M0.
- On-shore wind energy generation cost has decreased by 70% since 2009.
- Geothermal was the cheapest electricity in 2009 – it has increased in cost by 5% but is still less than coal, gas-peaker, solar thermal tower, and nuclear energy; the latter has increased by 33%.
Department of Energy’s New (September 2021) Solar Futures Study
Data such as above, and much more, have contributed to the September 8, 2021, dense, 279-page treatise released by the U. S. Department of Energy’s National Renewable Energy Laboratory (NREL) entitled Solar Futures Study (Solar Futures Study (energy.gov)). The study will come under extreme scrutiny since it’s already being described by the media as the “Biden Plan …” as in Newsweek’s Biden Plan Could See Solar Produce Enough Energy to Power All American Homes by 2035 (msn.com). The study develops and evaluates three core scenarios to envision a decarbonized grid and the next decade of solar energy:
In 2020, about 80 gigawatts (GW) of solar produced ~3% of U.S. electricity demand. By 2035, the new decarbonization scenarios aim for a cumulative solar power of 760–1,000 GW, serving 37%–42% of the U. S. electricity demand. The remaining power would be mostly from other zero-carbon resources, i. e., wind (36%), nuclear (11%–13%), hydroelectric (5%–6%), and biopower/geothermal (1%). The study also analyzes the potential for a more complete decarbonization by 2050 when the installed solar capacity would increase by nearly a factor of 7.
Proposed new thermal, chemical, and mechanical storage technologies would drive electrical grid flexibility. They are now in various stages of research, development, and commercialization, e. g., Spring 2021 Climate Corner reported on the world’s largest battery storage (300 MW) now, in California.
Solar Futures modeling predicts that solar will employ 500,000 to 1.5 million people across the country by 2035. And overall, the clean energy transition will generate around 3 million jobs across technologies.
Climate Corner applauds the bold, ambitious programs but asks:
- Has the low “capacity factor” of solar energy, specifically that there’s energy production during only 20 -25 % of the time, been considered?
- Assuming solar residential rooftop PV factors into the Solar Futures plans, then won’t its cost need to be slashed to be more in-line with utility solar?
- Are the added costs of storage due to transmission, both to and from the storage facility, factored in?
Secretary of Energy Jennifer M. Granholm said that “Achieving this bright future requires a massive and equitable deployment of renewable energy and strong decarbonization polices.”
One Last Thing (with a Bonus)
The Cold War with the Soviet Union in the 1960s is the context of a fascinating story featuring the U. S. Army, the Greenland icecap, scientific investigations serving as a coverup, and eventual climate change.
In 1960 the U.S. Army misled a visiting TV news anchor by stating that the purpose of their new, under-ice station Camp Century in northwest Greenland was to test polar construction techniques and a nuclear power plant, along with providing a base for scientific investigations. Decades later after Camp Century was abandoned was it revealed that the scientific studies were a coverup for a sinister project called “Iceworm”, centered on the Camp. The military intended to trench and cover 1000’s of miles of hollowed-out tunnels in which an arsenal of 600 ballistic nuclear missiles on rail cars would be in constant motion to avoid detection. The ICBMs would be targeted at the Soviet Union. But, after early tests of the proposed tunnels revealed that they would be impossible to maintain, project “Iceworm” was cancelled.
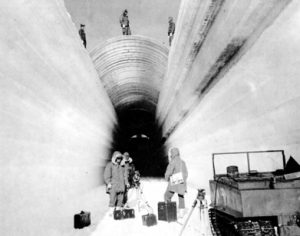
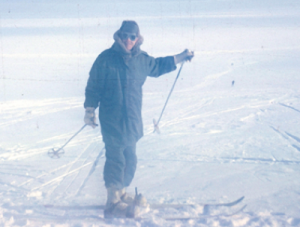
(Left) Project Iceworm trenching operation. (Right) George Jiracek skiing near Camp Century in July 1964 – note U.S. Army cold weather garb.
In 1964 an international scientific team made a 220 km-long-traverse from the ice cap edge to Camp Century, and vicinity, testing the use of radar to measure the depth to the bottom of the Greenland ice sheet. A thickness of ~1380 m was recorded at Camp Century. This success helped launch the ground penetrating radar (GPR) technique used to measure polar ice thickness and basal conditions from surface, aircraft, and satellites. Climate Corner’s George Jiracek, then a graduate student, was part of that 1964 team. In 1966, a deep drilling scientific team at Camp Century collected the first ice core from the bottom of an ice cap (at 1387 m depth), thereby, initiating the advent of tracing past climate continuously for the last 800,000 years from ice cores.
When Camp Century was decommissioned and deserted in 1967 it was assumed that accumulating snowfall would continue to bury the base forever. In 2016, a group of scientists evaluated the environmental impact of climate change there for the coming decades. They estimated that melt water could release the abandoned nuclear waste; 200,000 liters of diesel fuel; a nontrivial quantity of PCBs; and 24 million liters of untreated sewage into the environment as early as the year 2090.
So, Arctic climate change now has moved the Camp Century snow cover from one of net accumulation to one of net ablation and neither the U.S. nor Denmark (for which Greenland is a territory) have accepted responsibility for the future climate-change-caused cleanup.
http://www.brown.edu/news/2016-10-14/campcentury
http://en.wikipedia.org/wiki/Camp-Century
(Colgan et al., 2016: “The abandoned ice sheet base at Camp Century, Greenland, in a warming climate”. Geophysical Research Letters. 43 (15): 8091–8096. Bibcode:2016GeoRL..43.8091C. doi:10.1002/2016GL069688.)
A Bonus: To learn how surface ice melting on Greenland can cause glacial melting from the bottom up, thus raising global sea level, watch this NASA 1.12 minute animated video: Animation: How a Glacier Melts Below – YouTube.
Lead author of Climate Corner is George Jiracek, Navy veteran and Professor Emeritus at San Diego State University (Geophysics). Edited and Posted by Gary Butterfield. To comment and/or to suggest contributions to SDVFP Climate Corner please contact treasurer@sdvfp.org
.


