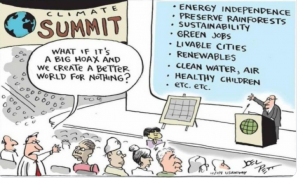
The October 31 to November 12 Glasgow, Scotland 26th annual United Nations Climate Change Conference (COP26) received much more media coverage than an August report that provided up-to date-facts needed for the diplomats who met in Glasgow.
In August, 234 scientists on the Intergovernmental Panel on Climate Change (IPCC) released their 6thAssessment Report. A contribution to this report by Working Group I was a Summary for Policy Makers (SPM) called “Climate Change 2021: The Physical Science Basis”. The SPM is a high-level summary of the current state of the global climate that will be accessed in 2021 Fall Climate Corner. https://www.ipcc.ch/report/sixth-assessment-report-working-group-i
The facts and consequences of global climate crises are awesome, depressing, and frightening in human and planetary terms. Climate Corner reviews timely climate science and news reports and selects a few that elicit a resounding “wow” response, positive or negative. Climate Corner shares a few “wow words and images”, with links, to motivate you to read more.
At a Glance
- Scientists were quick to say that “COP26 hasn’t solved the problem”. COP26 president Alok Sharma said “ambitions have fallen short…we have kept 1.5 degrees alive. But its pulse is weak”. ‘COP26 hasn’t solved the problem’: scientists react to UN climate deal (nature.com)
- Climate Corner will present selected findings verbatim from IPCC’s Working Group I: “The Summary for Policy Makers” all tagged with SPM. Findings are expressed as “statements of fact and/or by levels of confidence”.
- SPM levels of confidence are given by five qualifiers: very low, low, medium, high, and very high as type set in italics. However, other terms such as unequivocal, extremely likely, limited evidence, medium agreement, … are also italicized in the SPM.
- Climate Corner specifically spotlights IPCC-SPM findings of Human Influence on Global Warming, Greenhouse Gases, Global Cooling, Retreating Glaciers, Arctic Sea Ice Loss, and Global Sea Level Rises.
- Decadal predictions are reported of worse case planetary scenarios of human influence on climate change. A map predicted for the year 2100 of 2-meter (~7 feet) sea level rise in the San Diego, California area is presented.
- One Last Thing has a remarkable, interactive, New York Times sequence of space images documenting the toll on our planet that climate crisis has already brought.
IPCC, 2021: Summary for Policymakers (SPM)
In: Climate Change 2021: The Physical Science Basis.
Contribution of Working Group I to the Sixth Assessment Report of the Intergovernmental Panel on Climate Change
For starters:
SMP: It is unequivocal that human influence has warmed the (Earth’s) atmosphere, ocean, and land.
SMP: Earth in the last four decades has been successively warmer than any decade that preceded it since 1850.
Human Influence
Global Warming
SPM: It’s likely that the best estimate of human-caused global surface temperature increase is now 1.07OC. It is likely that a warming of 1 to 2 OC is due to well-mixed greenhouse gases in the troposphere.
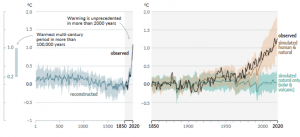
History of global temperature change and causes.
(Left) Solid grey is reconstructed years 1 to 2000 with very likely variations in grey shading. Vertical bar on left side is estimated very likely range during warmest in the last 100,000 years. Observed warming in 1850 – 2020 is unprecedented in last > 2000 years. (Right) Observed (black line) is annually averaged surface global temperature changes in last 170 years. Human and natural causes are in brown and natural solar and volcanic drivers are in green.
https://www.ipcc.ch/report/sixth-assessment-report-working-group-i
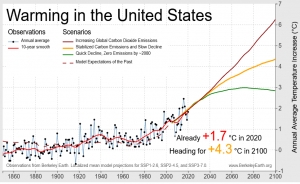
U.S. annual average temperature variations from 1859 to 2020 and projections to 2100 assuming zero level at ~1890. http://berkeleyearth.org/policyinsights/?mc_cid=b99a9b467f&mc_eid=60db7a9bf3
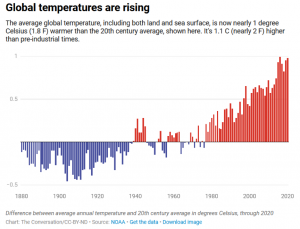
Difference between surface global average annual temperature and 20th century (1880- 2020) average in degrees OC. IPCC climate report: Profound changes are underway in Earth’s oceans and ice – a lead author explains what the warnings mean (theconversation.com)
Human Influence
Greenhouse Gases Responsible for Global Warming
SPM: The observed increases in well-mixed greenhouse gas (GHG) concentrations since around 1750 are caused by human activities and have continued to increase in the atmosphere. In 2019 the annual concentration averages were 410 parts per million (ppm) for carbon dioxide (CO2), 1866 parts per billion (ppb) for methane (CH4), and 332 ppb for nitrous oxide (N2O).
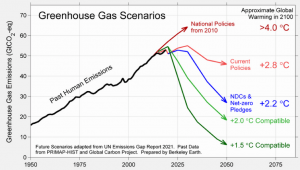
Global greenhouse gas emission scenarios from 1950 to 2021 and projected values based on policies including global warming in 2100 of >4.0 OC and 1.5 OC compatible.
http://berkeleyearth.org/policyinsights/?mc_cid=b99a9b467f&mc_eid=60db7a9bf3
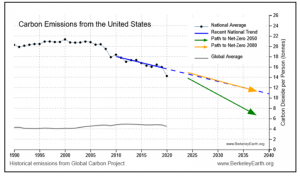
Carbon dioxide (CO2) per person emissions in US and globally from 1990 to 2020 with projections to 2040.
http://berkeleyearth.org/policyinsights/?mc_cid=b99a9b467f&mc_eid=60db7a9bf3
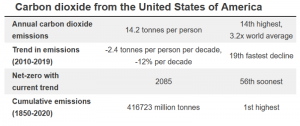
http://berkeleyearth.org/policyinsights/?mc_cid=b99a9b467f&mc_eid=60db7a9bf3
Human Influence
Global Cooling
SPM: The cooling of lower stratosphere of 0OC – 0.8 OC from 1979 to the mid-1990s is extremely likely caused by aerosol (related) depletion of ozone in the lower stratosphere.
Human Influence:
Retreating Glaciers and Arctic Sea Ice Loss Cause Global Sea Level Rises
SPM: Human influence is very likely the main driver of the global retreat of glaciers since the 1990s and the decrease in Arctic sea ice area since 1979.
SPM: It is very likely that human influence has contributed the observed surface melting of the Greenland ice sheet over the last two decades.
SPM: There has been no significant trend in Antarctic sea ice area from 1979 to 2020 and only limited evidence, with medium agreement, of human influence on the Antarctica Ice Sheet mass loss.
SPM: Global mean sea level increased by 0.20 [0.15 – 0.25] m between 1901 and 2018. Human influence was very likely the main driver with high confidence of global sea level increases up to 3.7 mm/year at least since 1971 with high confidence.
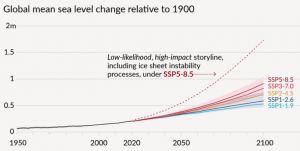
The lead author of the IPCC Sixth Assessment Report chapter on Earth’s oceans, ice and sea level rise, climate scientist Robert Kopp , comments on the profound changes underway in IPCC climate report: Profound changes are underway in Earth’s oceans and ice – a lead author explains what the warnings mean (theconversation.com).
“Sea level change through 2050 is largely locked in: Regardless of how quickly nations are able to lower emissions, the world is likely looking at about 15 to 30 centimeters (6 to 12 inches) of global average sea level rise through the middle of the century.
But beyond 2050, sea level projections become increasingly sensitive to the world’s emissions choices. If countries continue on their current paths, with greenhouse gas emissions likely to bring 3-4 C of warming (5.4-7.2 F) by 2100, the planet will be looking at a most likely sea level rise of about 0.7 meters (a bit over 2 feet). A 2 C (3.6 F) warmer world, consistent with the Paris Agreement, would see lower sea level rise, most likely about half a meter (about 1.6 feet) by 2100.”
How Bad Could It Be? The Worse Case Warming Scenarios
Recalling Article 2 of the Paris Agreement1 that was signed at COP21 in Paris, on 12 December 2015 and entered into force on 4 November 2016:
1 Article 2 of the Paris agreement set a target of holding global warming to “well below” 2 degrees Celsius (3.6 degrees Fahrenheit) and trying to limit warming to 1.5 degrees Celsius (2.7 degrees Fahrenheit) above preindustrial levels.
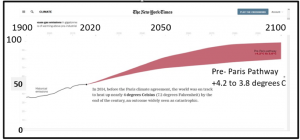
The New York Times reported in 2014, before the Paris climate agreement, that the world was on track to heat up by as much as + 4.2OC by the end of the century, an outcome that would be catastrophic! This is called Pre-Paris Pathway in the figure above. (The vertical axis is in CO2 equivalent in gigatonnes.) https://www.nytimes.com/interactive/2021/10/25/climate/world-climate-pledges-cop26.html
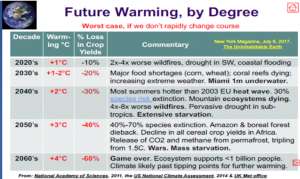
Future Warming, by Degree above is a PowerPoint slide produced by Paul Solomon, a retired electrical engineer, co-coordinator for the New Mexico 350.org, a climate advocate group.
Climate Corner received a copy of the slide after attending a talk by Mr. Solomon in 2017. The data and conclusions (Commentary) have not been “fact-checked” by Climate Corner. But, there’s no argument that worse wildfires, drought in the SW, and coastal flooding predicted for the 2020’s have already happened. The prediction that there could be +4OC warming in the 2060’s does not agree with the pre-Paris pathway above with +4OC by the end of the century. However, the “Warming in the United States” plot above from Berkeley Earth does predict +4OC in ~2060 for the Increasing Carbon Dioxide Emission scenario.
Independent of the scenario, +4OC global warming surely would be catastrophic!
Worse Sea Level Projections for San Diego, California
In the article cited above in “The Conversation”, Professor Koop states:
“Furthermore, under the most extreme emissions scenario considered, one could not rule out rapid ice sheet loss leading to sea level rise approaching 2 meters (7 feet) by the end of this century. And, fortunately, if the world limits warming to well below 2 C, it should take many centuries for sea level rise to exceed 2 meters – a far more manageable situation.”
To see what 7 feet of sea level rise above high tide would mean for the San Diego, California area, home of Climate Corner, we use the on-line, interactive Program by Climate Central: A Science & News Organization.
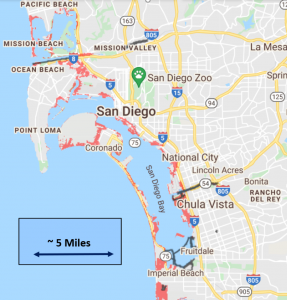
Land areas shaded in red are areas currently above high tide in the
San Diego area that would be submerged by 2 m (~7 feet) of sea level rise.
Those familiar with San Diego will notice that Mission Beach and the Silver Strand (between Coronado and Imperial Beach) no longer would exist. And, Ocean Beach and Point Loma are together as one island and Coronado has become two islands.
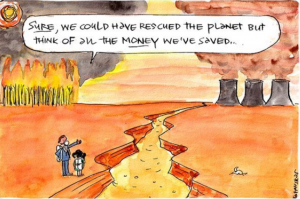
Let all of that sink in!
One Last Thing
The grim face of our climate changing planet was exposed by the New York Times in revealing interactive satellite sequences from space documenting glacial retreat in Chile, changing Arctic sea ice extent, sea level variations in the US Mississippi Delta resulting from oil and gas extraction, and wildfire scars near Lake Baikal in Russia. What Climate Change Looks Like From Space – The New York Times (nytimes.com)
Lead author of Climate Corner is George Jiracek, Navy veteran and Professor Emeritus at San Diego State University (Geophysics). To comment and/or to suggest contributions to SDVFP Climate Corner please contact treasurer@sdvfp.org. Edited by Gary Butterfield.


