Winter 2021-22 Climate Corner
Ocean Warming and Glacial Retreat To Raise Coastal US Sea Level 1 Foot By 2050
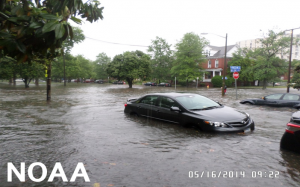
The U.S. coastline sea level is projected to rise in the next 30 years (2020 – 2050) more than in the last 100 years. Photo of flooding in Norfolk, VA in 2014.
JUST IN: SPECTACULAR FLOODING IN QUEENSLAND, AUSTRALIA!
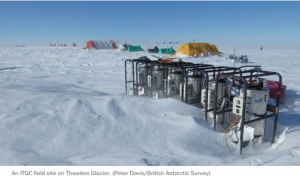
Thwaites Glacier, West Antarctica
Ice loss in the Thwaites Glacier ice-ocean system doubled in the last 30 years. The glacier currently contributes four percent of annual global sea level rise.
The end of 2021 marked another year-end accounting of the annual land, ocean, and global temperature changes along with ice melt, sea level, tidal flooding, drought, wildfires, and greenhouse gas emissions. The timing coincided with a US multi-agency 2022 Sea Level Rise Technical Report that had not been updated since 2017. It received major attention from decision makers and the press.
Climate Corner will emphasize the four key takeaways in the 2022 report including some relevant evidence from other sources. Then Antarctica will take center stage with the saga of the so-called “Doomsday Glacier”, the Thwaites Glacier. Along the way you will learn the diference between sea ice, ice shelf, ice sheet, and glacier.
The facts and consequences of global climate crises are awesome, depressing, and frightening in human and planetary terms. Climate Corner reviews timely climate science and news reports and selects a few that elicit a resounding “wow” response, positive or negative. Climate Corner shares a few “wow words and images”, with links, to motivate you to read more.
At a Glance
Ocean Facts:
- Ninety percent of global warming is occurring in the ocean, with the last decade warming the most and the year 2021 being the hottest.
- Covering more than 70% of Earth’s surface, the top few meters of the ocean store as much heat as Earth’s entire atmosphere.
Antarctic Facts:
- The Antarctica ice sheet holds 90% of fresh water on Earth’s surface.
- The West Antarctic Ice Sheet (WAIS) is about twice the area of Alaska. If it melted entirely, global sea level would rise by 3.3 meters (10.8 feet).
- The Thwaites Glacier ice-ocean system in the WAIS is the largest such system in Antarctica.
- Almost all of Antarctica’s winter sea ice melts during the summer.
Greenhouse Emmisions/California Wildfires Facts:
- Greenhouse emissions rose 6 percent last year after a record 10 percent(Covid-related) decline in 2020, fueled by a rise in coal power and truck traffic as the world economy rebounded from the pandemic.
- In California, roughly 2.6 million acres of land went up in flames in 2021.
- One Last Thing has an amazing New York Times’ “Postcards From a World on Fire,” interactive project from the 193 member states of the United Nations.
The Global Temperature in 2021
Berkeley Earth, a California-based non-profit research organization, published their report on global mean temperature during 2021 on January 12, 2022.
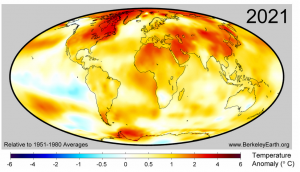
The map above shows how local temperatures in 2021 have increased relative to the average temperature in 1951-1980. In 2021, 87% of the Earth’s surface was significantly warmer than the average temperature during 1951-1980, 11% was of a similar temperature, and only 2.6% was significantly colder.
Four Key Takeaways from the 2022 Sea Level Rise Technical Report
1. The Next 30 Years of Sea Level Rise
Sea level along the US coastline is projected to rise, on average, 10 – 12 inches (0.25 – 0.30 meters) in the next 30 years (2020 – 2050). Sea level rise will vary regionally along US coasts because of changes in both land and ocean height.
Sea level rise is caused primarily by two factors related to global warming: the added water from melting ice sheets and glaciers and the expansion of seawater as it warms. (2022 Sea Level Rise Technical Report)
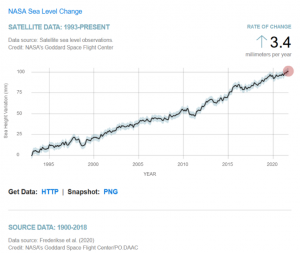
The graph below tracks the change in global sea level from 1993 -2021as observed by satellites. The rate change is now 3.4 mm/year.
2. More Damaging Flooding Projected
Sea level rise will create a profound shift in coastal flooding over the next 30 years by causing tide and storm surge heights to increase and reach further inland. By 2050, “moderate” (typically damaging) flooding is expected to occur, on average, more than 10 times as often as it does in 2020 and can be intensified by local factors. (2022 Sea Level Rise Technical Report)
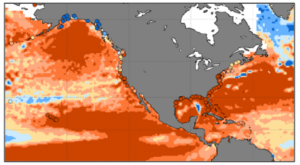

Regional sea level linear rate of rise (mm/yr) from satellites between 1993- 2020. (2022 Sea Level Rise Technical Report)
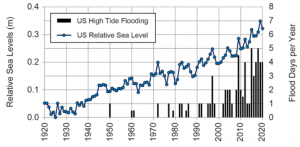
US median rate of minor high tide flooding from 98 NOAA tide gauges along coastlines (excluding Alaska) compared to relative sea level referenced to the lowest annual (1925) value. (2022 Sea Level Rise Technical Report)
JUST IN: SPECTACULAR FLOODING IN QUEENSLAND, AUSTRALIA!
3. Emissions Matter
Current and future emissions matter. About 2 feet (0.6 meters) of sea level rise along the U.S. coastline is increasingly likely between 2020 and 2100 because of emissions to date. Failing to curb future emissions could cause an additional 1.5 – 5 feet (0.5 – 1.5 meters) of rise for a total of 3.5 – 7 feet (1.1 – 2.1 meters) by the end of this century. (2022 Sea Level Rise Technical Report)
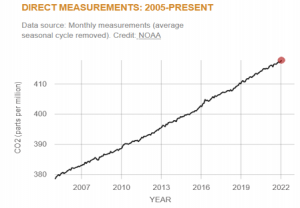
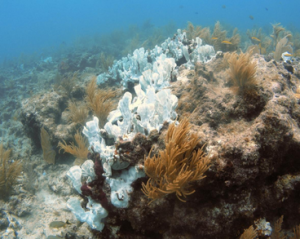
(Left) Atmospheric carbon dioxide in parts per million from 2005 to 2022 after annual variations are removed. (Right) Coral bleaching is a consequence of a warming ocean. The image shows bleached coral off Islamorada, Florida. Credit: Kelsey Roberts/USGS
Near-surface ocean acidity has increased by 30% since the beginning of the Industrial Revolution. The global ocean has absorbed beween 20% and 39% of total anthropogenic carbon dioxide emissions in recent decades (7.2 to 10.8 billion metric tons per year).
4. Continual Tracking
Continuously tracking how and why sea level is changing is an important part of informing plans for adaptation. Our ability to monitor and understand the individual factors that contribute to sea level rise allows us to track sea level changes in a way that has never before been possible (e.g., using satellites to track global ocean levels and ice sheet thickness). Ongoing and expanded monitoring will be critical as sea levels continue to rise. (2022 Sea Level Rise Technical Report.https://aambpublicoceanservice.blob.core.windows.net/oceanserviceprod/hazards/sealevelrise/noaa-nos-techrpt01-global-regional-SLR-scenarios-US.pdf).
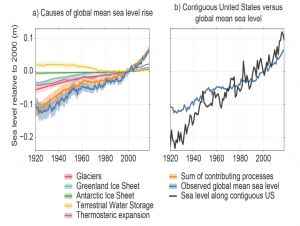 (Above) In general, it’s clear that global mean sea level (GMSL) rise is a direct effect of climate change, resulting from a combination of thermosteric expansion of warming ocean waters and additional water from the loss of ice from glaciers and ice sheets. The Antarctic ice sheet was stable to about 2000.
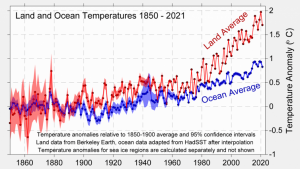
Berkeley Earth Land and Ocean Temperatures 1850- 2021.
Antarctica’s Riskiest, Doomsday Glacier
The threat from Thwaites: The retreat of Antarctica’s riskiest glacier (phys.org)
Antarctica’s Thwaites Glacier (Note: Skip ad to play a 2:27 minute video) is retreating rapidly as a warming ocean slowly melts its ice from below, leading to a faster flow, more fracturing and a threat of collapse,
The Thwaites ice shelf could collapse within the next three to five years. If it does, global sea levels would rise by several feet putting millions of people living in coastal locations in danger from extreme flooding.
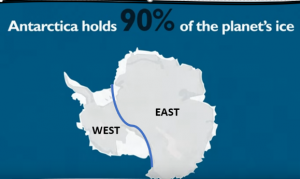 Using this typical orientation of the Antarctic Continent, the more massive portion to the right is called the East Antarctic Ice Sheet (or simply East Antarctica). It contains the thickest ice on Earth at 15,700 ft ( 4,800 m) and the South Pole with 2,803 m (9,197 ft) depth of ice. The TransAntarctic Mountain Range, very crudely located by the blue curve above, marks the approximate boundary between East and West Antarctica. Antarctica contains 90% of Earth’s ice, East Antarctica has 80% of it. West Antarctica contains the Thwaites Glacier, Earth’s widest glacier, also called “the doomsday glacier” because it’s believed to be an omen of what’s to come. This has led to a current joint US-UK $50 million mission to study the Thwaites Glacier.
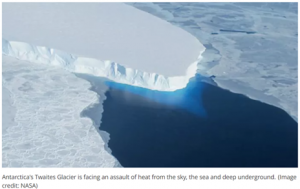
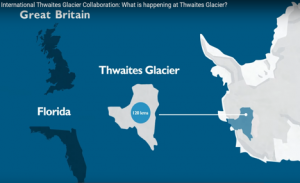 (Left) Thwaite’s glacier face extends for about 120 km and varies from 18-23 m above water. This ocean-ward, floating, extension is an ice shelf which, if freely-floating, will not contribute to sea level increase if it melts; just as the melting ice already in your drink glass doesn’t cause the liquid to rise. (Right) The area of the Thwaites Glacier alone is about the size of Great Britian and grearter than Flordia.
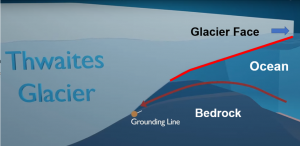
Scientists describe the possible Thwaites Glacier collapse by three mechanisms:
- Melting of the bottom of the floating extension of the glacier (the ice shelf) by warm ocean water as schematically shown above by the upper red line.
- A retreating landward “grounding line” where the glacier attaches to the sloping bedrock ridge shown by the yellow dot at the end of the red curve which indicates warm water movement.
- As the grounding line moves landward and downward along the dipping bedrock, there’s a thicker slice of ice shelf above, thereby, increasing the ice shelf mass exposed to the warm ocean. The Thwaites’ grounding line has retreated 14 km since 1992.
 The Thwaites’ extended ice shelf is breaking into hundreds of fractures leading to icebergs of all sizes. Some fractures are as long as 10 km.
In the last 30 years the amount of ice loss from the Thwaites Glacier and neighboring glaciers such as the Pine Valley have accounted for more than 10% of today’s global sea level rise.
To learn more about the Thwaites Glacier open:
Everything You Ever Wanted to Know About Thwaites Glacier …
https://thwaitesglacier.org/sites/default/files/…..
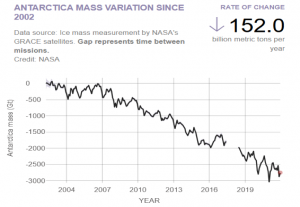 The Antarctic has lost nearly 3000 billion (giga) metric tons of ice mass since 2002 at a current rate of 152 billion tons per year. NASA’s GRACE satellites measures mass by its effect on gravity – GRACE (Gravity Recovery and Climate Experiment) actually uses two satellites to measure both gravity and its gradient.
One Last Thing
Postcards from a World on Fire
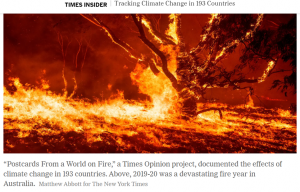
Cities swallowed by dust.
Human history drowned by the sea.
Economies devastated; lives ruined.
These 193 stories show the reality of climate change. In every country in the world.
So begins the video introduction to “Postcards From a World on Fire,” an ambitious, multimedia project reported and developed by more than 40 writers, photographers, editors and designers on the Opinion desk at The New York Times. You scroll down to see how the planet is changing by tapping green buttons for sounds, videos, and learning. This is absolutely fantastic! Kudos to the New York Times.
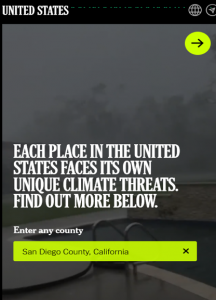
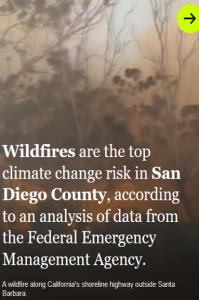
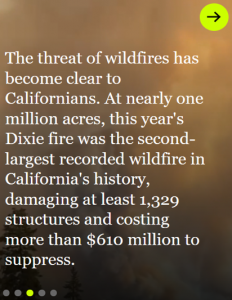
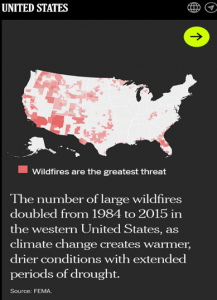
By clicking on the globe icon you choose the country. Every country has a different format. You’ll listen to mountain gorillas in Rwanda, follow divers doing coral restoration in Belize, see flooding from cyclone Eloise in Mozambique, find out how ice melt in the Sea of Okhotsk is affecting sushi prices in Japan, and much, much, more. For the United States, one is asked to “Enter any county”. For San Diego County, California the following information follows.
Lead author of Climate Corner is George Jiracek, Navy veteran and Professor Emeritus at San Diego State University (Geophysics). To comment and/or to suggest contributions to SDVFP Climate Corner please contact treasuresdvfp.org Edited by Gary Butterfield.


