Scientists from US Coast Guard Cutter Healy on NASA ICESCAPE Mission, July 2011: NASA/Katyryn Hansen.
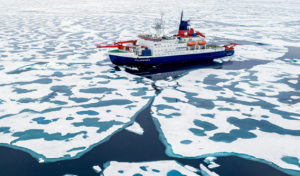
German Icebreaker Polarstern deliberately frozen in Arctic Ocean during 2019- 2020 MOSAIC scientific expedition.
The facts and consequences of global climate crises are awesome, depressing, and frightening in human and planetary terms. Climate Corner reviews timely climate science and news reports and selects a few that elicit a resounding “wow” response, positive or negative. Climate Corner shares a few “wow words and images”, with links, to motivate you to read more.
At a Glance
• After previously focusing on Greenland and Antarctic ice melt, the Arctic Ocean takes Winter Climate Corner’s center stage. The year-end (December 2020) Arctic sea ice losses over the 42-year satellite record are 1.97 million sq km (761,000 sq mi), approximately three times the size of Texas. It led to a “record-smashing” 3 ½ months of a “transitable” open Arctic Ocean, particularly along the passage adjacent to Russia.
• A shrinking Arctic sea ice opens new shipping lanes, resource exploration, and geo-political unrest. Russia is expanding its military presence and the US Navy has responded. Scientists from 20 countries have just completed a two-year, ship-based portion of the largest Arctic scientific expedition in history.
• Diminishing Arctic sea ice is ultimately caused by a warming Earth from fossil fuel greenhouse emissions. Climate Corner quantifies this and explains the ice-albedo feedback and Arctic amplification processes. Computer simulations now predict that the Arctic Ocean will be ice-free by the summer of 2035.
• It is affirmed that planetary greenhouse emissions were reduced in 2020 because of COVID-19 virus restrictions.
• Finally, a new facet in future Climate Corners called “One Last Thing” is introduced. ExxonMobil’s goal for the 2040 global energy mix comes under scrutiny.
Record 2020 Arctic Shipping Access Follows High Summer Temperatures and Low December Sea Ice Extent
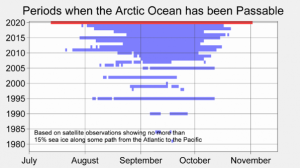
Northern Siberia experienced “record-shattering” 2020 summer temperatures including the first temperature of over 100o Fahrenheit north of the Arctic Circle, recorded in June 2020 at Verkhoyansk, Russia. This contributed to an unprecedented, continuous ship passage time-window between the Pacific and Atlantic Oceans in 2020. As illustrated below, 25 years ago such trips were very rare.
The National Snow and Ice Data Center (NSIDC) reported that the Arctic sea ice extent averaged during December 2020 was the third lowest in the 42-year satellite record. Overall, 2020 was historically the 2nd warmest Arctic year and it had the 2nd lowest minimum Arctic sea ice extent ever recorded (see map below).
Ho, ho, ho-hum December | Arctic Sea Ice News and Analysis (nsidc.org)
http://berkeleyearth.org/global-temperature-report-for-2020
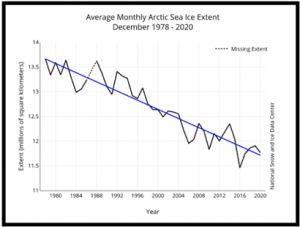
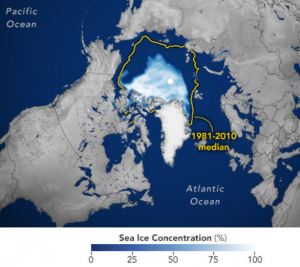
(Left) Average December 1978 – 2020 Arctic Sea ice extent in millions of square kilometers. The linear decline (shown) for December sea ice extent is 3.6 % per decade. Ho, ho, ho-hum December | Arctic Sea Ice News and Analysis (nsidc.org) (Right) Comparison of the minimum Arctic sea ice extent in 2020 on September 15 to the 1981-2010 median extent on that same day historically in yellow. This 2020 extent is the second lowest ever recorded. Notice the excessive 2020 sea ice loss along the Russian coastline. https://earthobservatory.nasa.gov/images/147306/arctic-sea-ice-reaches-second-lowest-extent
US Navy Releases 2021 “a Blue Arctic”
Russia, with an Arctic Ocean coastline of 15,003 miles (compared to 1060 miles for the US), is investing heavily to enhance its Arctic defense and economic sectors. To counter, on January 5, 2021 the US Navy published a blueprint called “a Blue Arctic” that would “increase its presence on, under, and above the Arctic”. It allows for permanent, rotational, or temporary military forces as well as adding equipment and infrastructure across the region. Training and exercises with allies and partners in and around the Arctic will be increased.
https://beta.documentcloud.org/documents/20441321-arctic-blueprint-2021-final
Currently the farthest north permanent US military base is Thule Air Base in northwest Greenland. A construction cost in 1951-52 was estimated to be over $2.5 billion in today’s dollars.The logistical apects were considered comparable to the Manhattan Project or the Allied Normandy landing. (The Ice at the Top of the World, Jon Gertner, 2019)
The multi-year, 20-nation Multidisciplinary drifting Observatory for the Study of Arctic Climate (MOSAIC) project cost $150 million. The accumulated pool of scientific data and samples is expected to carry Arctic research long into the future.
No budget is proposed for the Navy’s “a Blue Arctic” plan.
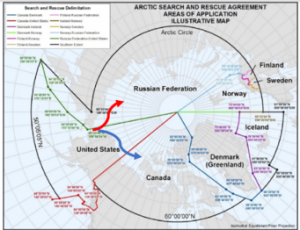
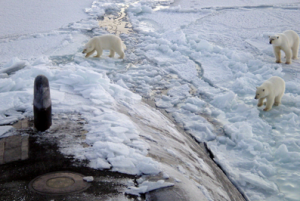
(Left) Plotted, arbitrarily, are the origins of two major Arctic Ocean shipping lanes beginning at the Bering Strait. The red arrow route traverses along the Russian coast to Norway and the blue arrow sea lane passes along the Alaskan/Canadian coasts to the west coast of Greenland. (Right) Temporary US Navy Arctic operations, such as the surfacing of the USS Honolulu in 2014, have been visited by polar bears which are endangered because the sea ice they rely on to hunt from is disappearing.
Annual Arctic Sea Ice Change Explained
A combination of land, sea, and global temperatures are the key drivers of the physical response of Arctic sea ice. In winter, the Arctic Ocean has maximum sea ice coverage and thickness with an insulating layer of snow. Fresh snow is the planet’s brightest natural surface reflecting a huge 85% of incident solar radiation. The ratio of reflected to incidence radiation is called the reflection coefficient, also the albedo: 0.85 in this case. (Note: There are dependencies on the incident angle and wavelength(s). Both are neglected in this discussion.) As temperature rises in spring and summer, the snow and sea ice melts, exposing the dark ocean underneath. Open ocean absorbs much more solar radiation (90%) and only reflects about 10%, therefore, it has an albedo of 0.10. The higher solar absorption of open ocean increases the warming of the ocean and the air above, thereby, melting more ice from the bottom and top. This positive sea ice-radiation feedback loop over the course of the year is called the ice-albedo feedback. Of course, global warming is caused by fossil fuel carbon emissions (absorbed by the Earth’s oceans and atmosphere). Therefore, it adds an overall, increasingly warmer, background temperature to the feedback process.
Arctic amplification (AA) posits that Arctic greenhouse-induced warming is higher than the rest of the planet and affects mid-latitude weather and climate. AA is expressed as a ratio or difference between the Arctic (65-90oN) versus global or northern hemisphere (0-90oN) surface air temperatures. One process to explain AA has two steps: 1. Increased solar absorption and storage during the low-sea-ice, warm season is followed by: 2. Long-wavelength release of this energy that amplifies Arctic warming in the cold season. Such solar radiation storage and release is not ice-albedo feedback.
https://doi.org/10.1038/s41467-018-07954-9
https://www.nature.com/articles/s41558-020-00954-y
Ice-free Arctic Ocean Predicted by 2035
Recently, very impressive computer simulations, support a shocking prediction of an ice-free Arctic Ocean by the summer of 2035!
https://phys.org/news/2020-08-evidence-loss-arctic-sea-ice.html
Sea-ice-free Arctic during the Last Interglacial supports fast future loss, Nat. Clim. Chag. 10, 928-932
CO2 Emissions Decline During COVID-19
An unexpected reduction in global atmospheric CO2 in 2020, compared to 2019, was caused by COVID-19 restrictions that significantly reduced energy consumption in every category except residential use (decreases were largest in surface travel, air travel, and industry). The Global Carbon Project reported that the US and the world had 2020 decreases in CO2 emissions of 12 and 7 %, respectively. Still, the global 2020 CO2 level is 61% higher than in1990. Berkeley Earth concludes that a record was set in 2020 for the warmest annual land-average on Earth since 1850.
https://www.globalcarbonproject.org/carbonbudget/20/files/GCP_CarbonBudget_2020.pdf
http://berkeleyearth.org/global-temperature-report-for-2020
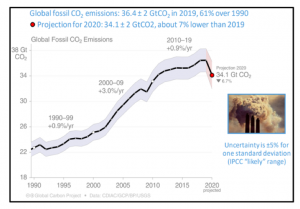
Global fossil CO2 emissions from 1990 to 2020 (projected) in giga (billion,109) metric tons of CO2. 2020 GtCO2 is projected to be 6.7% below the 2019 value because of COVID-19 restrictions. https://www.globalcarbonproject.org/carbonbudget/20/files/GCP_CarbonBudget_2020.pdf
One Last Thing
Climate Corner often reads exxonmobil.com’s EnergyFactor website. Their prediction of the global energy mix in 2040 was displayed in January 2020 in The power of natural gas – Energy Factor (exxonmobil.com), under Part Four, The Future of Energy as:
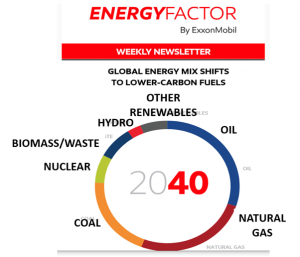
*Larger, bolder labels have replaced the smaller, faint lettering.
Do you think that a reasonable goal for the year 2040 would be for 75% of the global energy mix to be oil, natural gas, and coal? These three are the worst global emitters of CO2, the most dominant greenhouse gas! Also, do you believe that other renewables, meaning solar, wind and geothermal, will amount to less than 10% of all global energy in 2040? With these ExxonMobil energy goals, the prediction that global warming could destine our planet Earth to have the climate of Venus within 1000 years when human life would be unsustainable, seems more likely! The Venus prediction was made by Stephen Hawking in the last book he published, in 2018, the year he died. (Brief Answers to the Big Questions, Stephen Hawking, 2018)
Lead author of Climate Corner is George Jiracek, Navy veteran and Professor Emeritus at San Diego State University (Geophysics). To comment and/or to suggest contributions to SDVFP Climate Corner please contact treasurer@sdvfp.org.


